
Ecosystem
April 11, 2026
The 2026 ‘State of Midwest Innovation Ecosystem’ report with Dealroom
Phil Vella

Become a member & keep reading for free, or choose a paid membership.
Access all our content & email newsletter
We’ve just released the first-ever ‘State of Midwest Innovation Ecosystem’ report, in association with Dealroom. Much of the data highlights what many of us suspect: the Midwest innovation economy no longer has much to prove from a scale perspective. Its problem, the data suggests, is that capital still hasn’t caught up. The report shows that the region has a large and increasingly productive startup market, but one that continues to receive a relatively small share of U.S. venture funding.
The Midwest is categorized in the data as comprising 12 states: Ohio, Michigan, Indiana, Illinois, Wisconsin, Minnesota, North Dakota, South Dakota, Nebraska, Missouri, Kansas and Iowa. This region generates about 16% of U.S. GDP while capturing only around 3-5% of U.S. venture capital. These numbers are even more striking when considering that the region’s combined economy of approximately $4.7 trillion is large enough that if it were a country, it would rank as the fourth-largest economy in the world. As we say in the report, this is one of the larger capital-allocation mismatches across the U.S. economy.
Access the Report here
The overarching takeaway is that the Midwest is already economically significant, producing venture-scale companies, but still being funded as if it were a secondary market. As it says in the Executive Summary: “The Midwest is one of the most underappreciated innovation ecosystems in the world.”
In this article, we will extract some of the key findings to help our readers here and beyond to better understand.

Pipeline, Value Creation most valuable industries and startup mafias in the Midwest
Taking a look at the pipeline of companies, there are more than 10,000 startups, 1,302 breakouts, 304 scaleups, and 99 companies valued at more than $1 billion with nine that are valued at more than $10 billion. Whatever argument people want to have about whether the Midwest is underhyped or undercovered: this is not a region with a theory about its startup scene. It already has one in numbers.
The same can be said for value creation. Midwest startup enterprise value grew from $174 billion in 2016 to $660 billion in 2026, a 3.8x increase over a decade and a 14% compound annual growth rate.
They define Enterprise Value as “the sum of all the valuations of startups in that specific ecosystem. This is a combination of private company valuations based on most recent VC rounds (which is either announced or estimated based on benchmarks), realized exit value, or publicly disclosed valuations, and public company enterprise value.”
EDITORS CHOICE:
Read more about Midwest Startup Funding
Read about what gets funded, where in the Midwest
Read the latest Midwest University Rankings
The report points unsurprisingly to Health, Biotech and Life Sciences, and Health Tech as the region’s core strengths, together accounting for more than $211 billion in enterprise value. It also identifies AI, robotics, aviation and defence as fast-emerging sectors. This matters because it is the kind of information that can allow regions to focus on which verticals can actually shape where talent, capital and follow-on company formation tend to cluster.
Access the Report here
The report also points to the Midwest’s foundations as not just industrial or academic in an abstract fashion. We know there are world-class research universities, deep corporate talent networks and a growing local investor base. Alongside this there is also data on local startup ‘mafias’; alumni of successful businesses that have gone on to build their own which is a familiar pattern in more established startup hubs. The largest of these in the Midwest is the “Groupon Mafia”, an example of how company-building talent can recycle into new ventures and ecosystems. The suggestion is that versions of that pattern need to become more visible across the Midwest too.
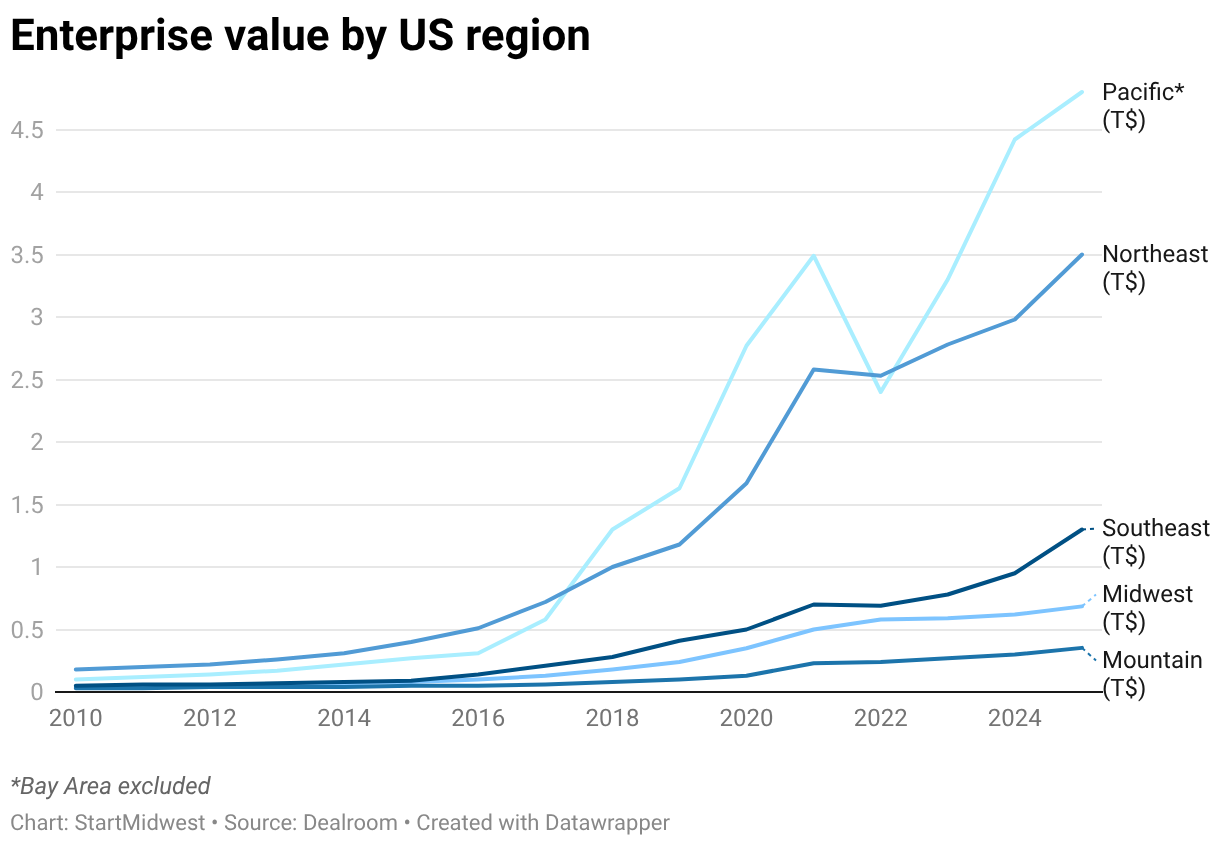
When comparing the region, Midwest combined enterprise value in 2026 is at $685 billion, behind the West Coast (excluding the Bay Area) at $4.8 trillion, the Northeast at $3.5 trillion and the Southeast at $1.3 trillion. These are not minor variations, especially against regions outside the coast.
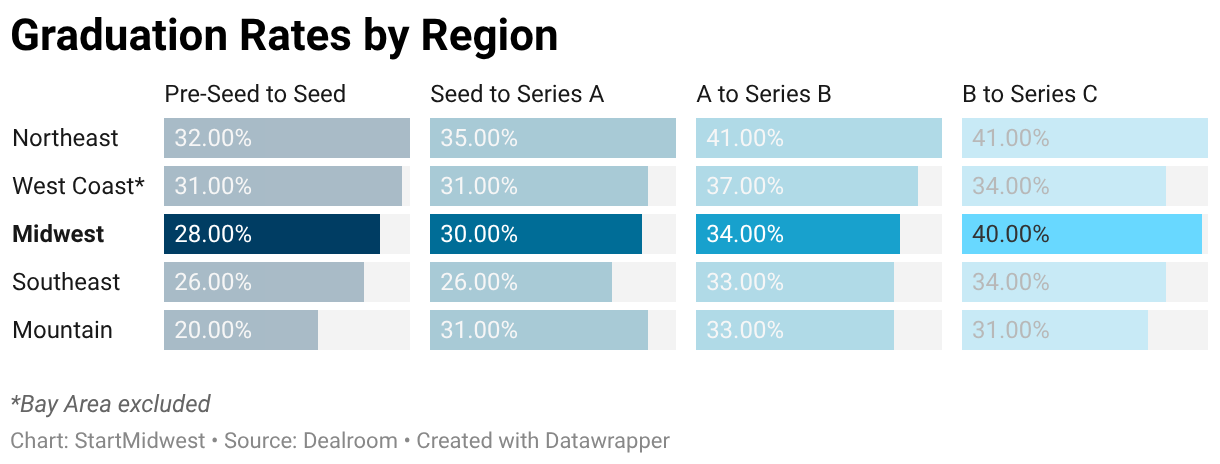
We have Impressive Graduation Rates in the Midwest
The graduation-rate suggests the Midwest is not weak across the board. It posts a 30% rate from Seed to Series A, 34% from Series A to Series B and 40% from Series B to Series C, second only to the Northeast on that last measure. While it implies the region is capable of advancing companies through later stages at a respectable clip, these differences may seem minimal, but over time through each stage they make a huge difference and also highlight the undervalued nature of the regions. Applying them to an example cohort of 100 companies starting at pre-seed, The Northeast would graduate 1.88 companies to Series C, vs 1.14 in the Midwest and a very close 1.21 in the West. The fact these are applying vastly different amounts of capital to these stages demonstrates yet another mystery of the region: why?
The outcome-rate slides demonstrate this problem further. The Midwest trails the Northeast and West Coast on the share of funded startups that become $1 billion-plus or $10 billion-plus companies. The Midwest is at 1.0% on funded-to-$1B+ outcomes, compared with 2.0% for both the Northeast and West Coast. On funded-to-$10B+ outcomes, it shows the Midwest at 0.12%, versus 0.21% in the Northeast and 0.19% on the West Coast. Getting companies started and moving them along is not quite the same thing as building enough of the very largest outcomes and these percentage differences equate to billions in outcomes.

The future of the Midwest Innovation Ecosystem
The best read of this data is that the region has enough economic scale, enough startup density and enough sector depth that underinvestment looks less like a temporary oversight and more like a structural blind spot.
That is the conversation we need to push forward.
The question is no longer whether the Midwest can produce important companies. By our report’s own numbers, it already does and it always has. The more pertinent question is why a region this large, this productive and this established in company formation still captures such a small share of the capital that shapes who gets to scale fastest.
Even importantly, what can we all do about it? We’ll keep telling the story. You can get in touch if you’d like to help us continue to do so.
Access the Report here
Trending Stories
All Rights Reserved
Copyright 2026 Zeroto7 LLC
Powered by:


